IMGA Benchmarking
Data from independent groups, creating outcomes for independent groups
The only benchmarking initiative grounded entirely in member-contributed data – exclusive to contributing IMGA members
2025 ROUND • 2024 DATA
Current
2026 ROUND • 2025 DATA
Expected
With a multispecialty focus and representation from some of the nation’s most established independent medical groups, IMGA benchmarking delivers metrics that are meaningful because they are member-generated – reflecting how independent practices actually operate. The result: precise, actionable intelligence to sharpen clinical quality, operational efficiency, and financial performance.
Participation is exclusive to contributing IMGA members, preserving the integrity and relevance that make every benchmark worth trusting. The next survey round opens mid-May, and findins will be featured at the IMGA 2026 Annual Forum.
The initial benchmarking report this year was very impressive. Looking forward to participating again.
See Exactly How Your Group Stacks Up
And where your group is heading...
The groups that benchmark consistently are the ones that grow. IMGA members participating in the 2025 round received access to 41 metrics that reveal where their practice stands — and what moves to make next. See a sample and the full list of metrics below.
*This is a generic sample of data; this does not reflect actual data
2025 Round Key Benchmark Metrics
Income Statement, Staffing, and Facility Metrics | ||
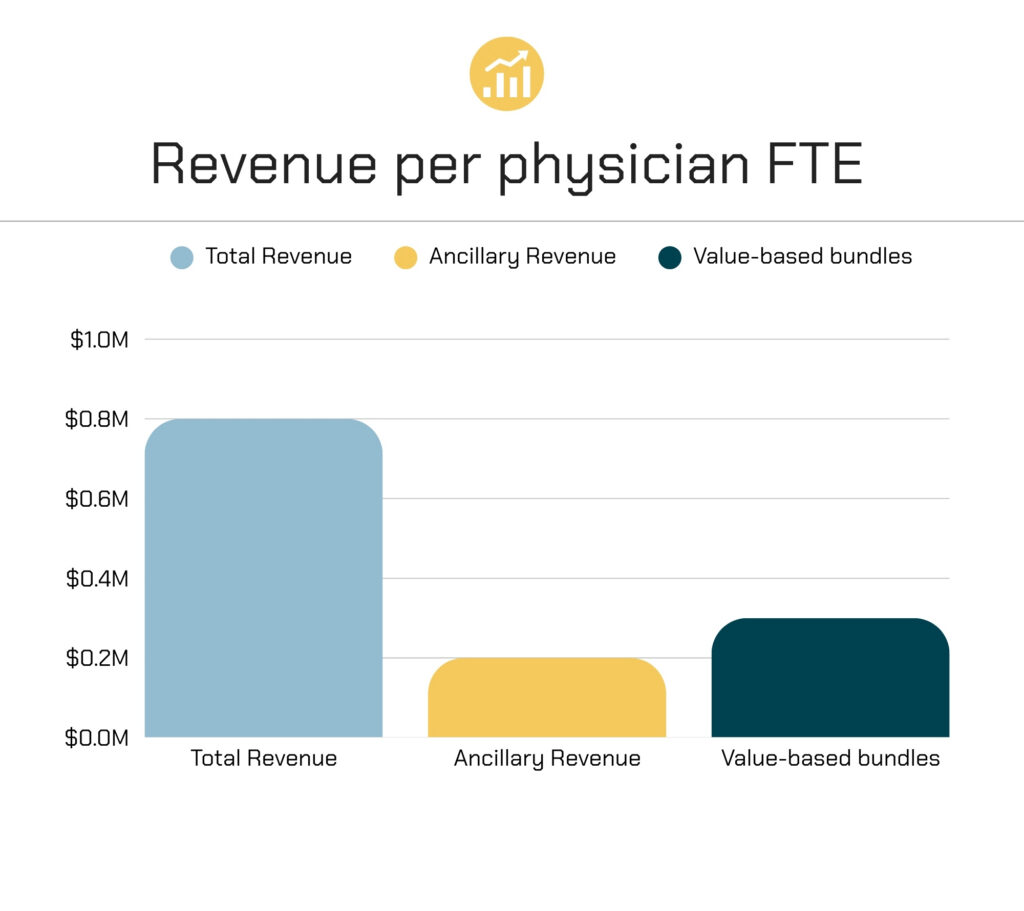
Total Revenue per Physician FTEs | Technology Expenses per Physician FTEs | Physician Compensation as a Percent of Total Revenues |
Total Patient Related Revenue per Physician FTEs | Malpractice Expenses as a Percent of Total Revenues | Extender Compensation per Extenders FTEs |
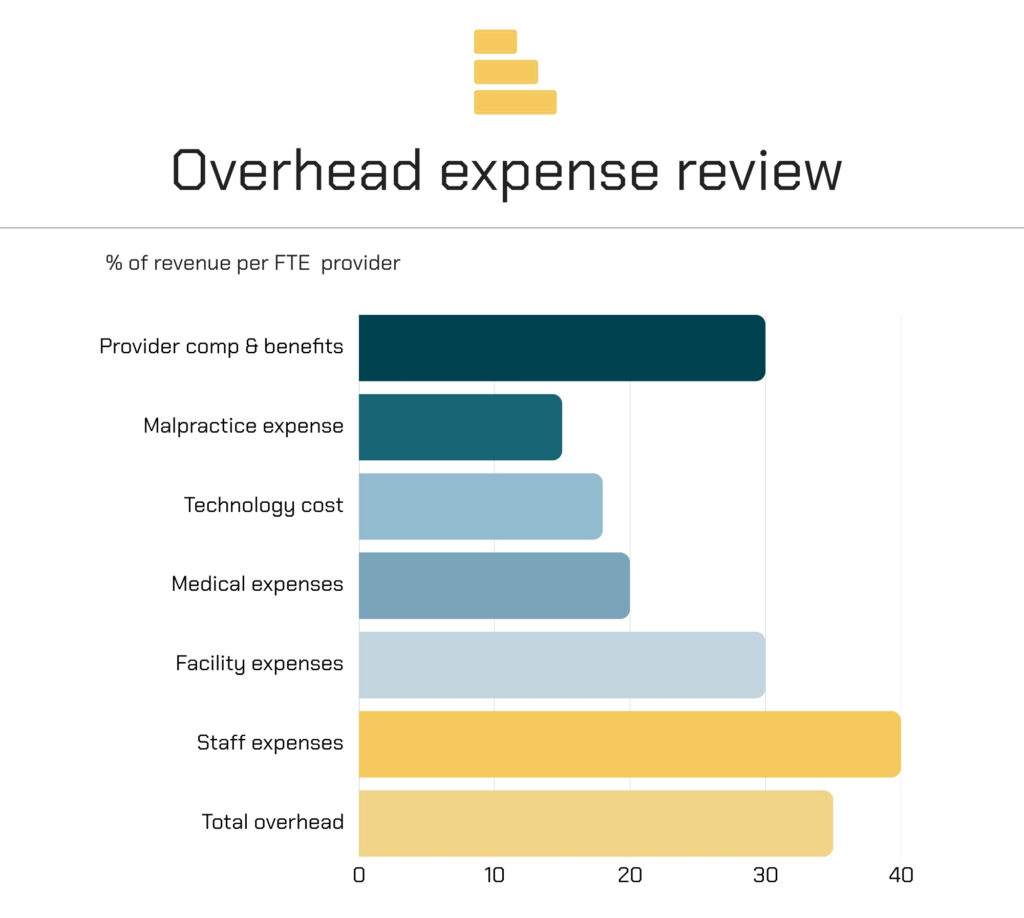
Overhead Expenses as a Percent of Total Revenues | Malpractice Expenses per Physician FTEs | Extender Compensation as a Percent of Total Revenues |
Overhead Expenses per Physician FTEs | Physician Owner Compensation as a Percent of Total Revenues | Nonprovider FTEs per Physician FTEs |
Staff Expenses as a Percent of Total Revenues | Physician Owner Compensation per Physician FTEs | Nonprovider FTEs per Provider FTEs |
Staff Expenses per Physician FTEs | Staff Expenses as a Percent of Total Overhead | Physician Extenders per Physician FTEs |
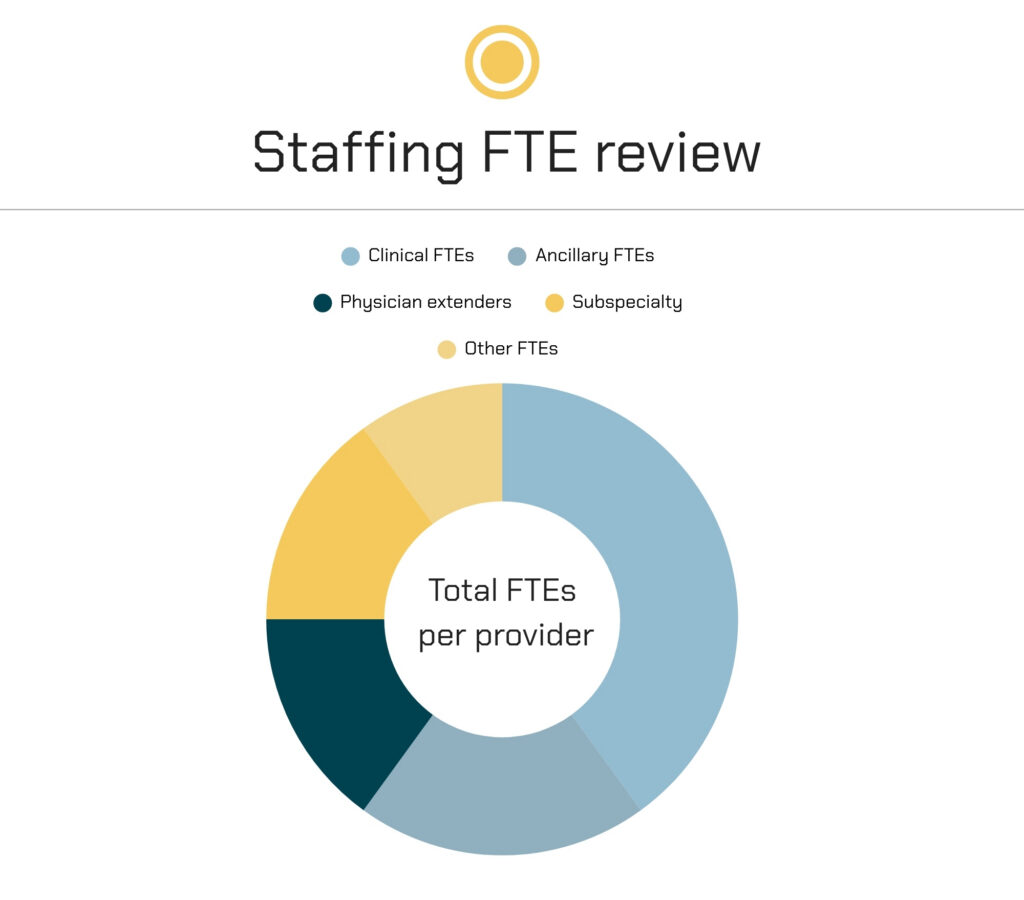
Ancillary Revenue per Physician FTEs | Facility Expenses as a Percent of Total Overhead | Clinical FTEs per Physician FTEs |
VBC per Physician FTEs | Staff and Facility Expenses as a Percent of Total Overhead | Ancillary FTEs per Physician FTEs |
Facility Expenses as a Percent of Total Revenues | Staff and Medical Expenses as a Percent of Total Overhead | NPs / PAs FTEs per Physician FTEs |
Facility Expenses per Physician FTEs | Medical Expenses as a Percent of Total Overhead | Total Employees per Physician FTEs |
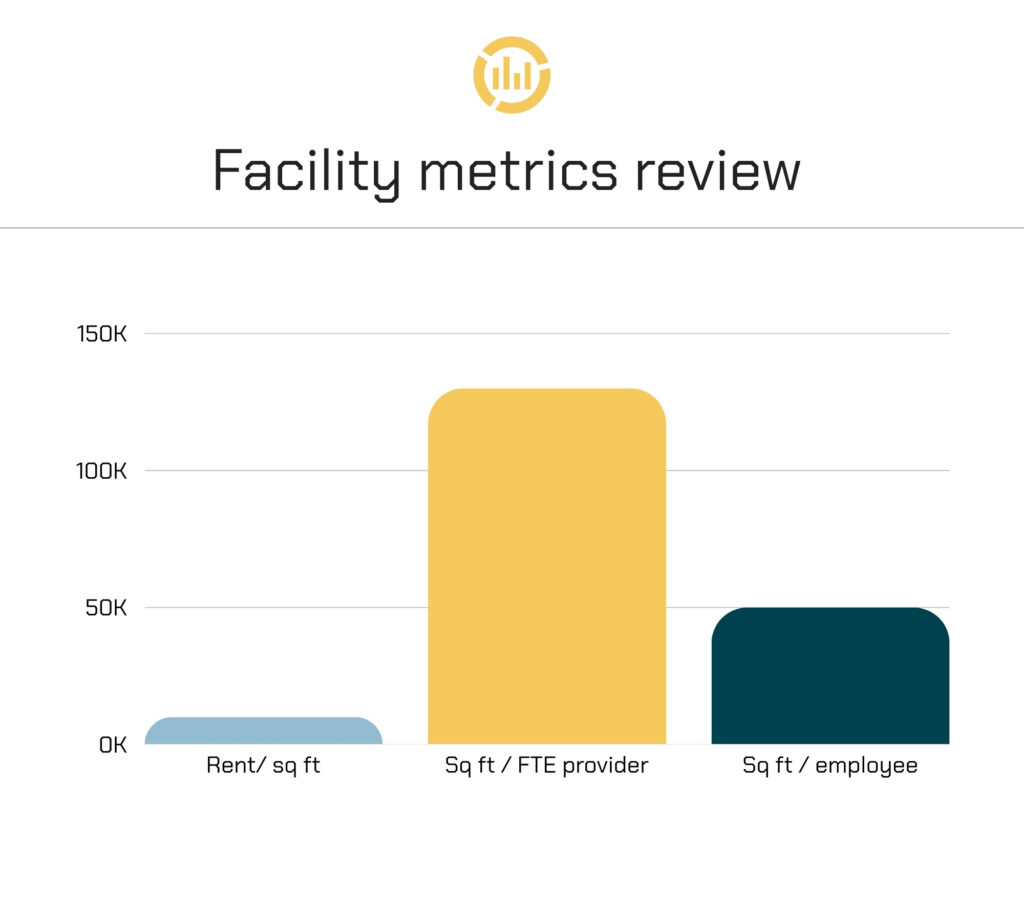
Total Rent per Sq Ft. | Technology Expenses as a Percent of Total Overhead | Square Footage per Physician FTEs |
Medical Expenses as a Percent of Total Revenues | Malpractice Expenses as a Percent of Total Overhead | Square Footage per Provider FTEs |
Medical Expenses per Physician FTEs | Staff, Facility, and Medical Expenses as a Percent of Total Overhead | Sq Ft per Total Employees (FTEs) |
Technology Expenses as a Percent of Total Revenues | Physician Compensation per Physician FTEs | |
More groups. More data. More value – year after year. Don’t miss the next round. Join IMGA. Benchmarking survey now open!
IMGA Member